
Instagram Account Comparison in 5 Minutes

![]() 6 min read
6 min read
This tool allows you to quickly compare the dynamics of multiple accounts: all social media accounts of your brand or competitor accounts. Simply put, it generates a table that shows the change in quantity and dynamics of:
- followers
- posts
- likes
- comments
- reposts
- coverage
- engagement (ER)
You can read more about ER on the page – “What is Engagement Rate and how is it calculated on LiveDune?” All data from this report can be exported to Excel for further analysis.
Contents
1. How to make a report to compare accounts
2. Comparing competitor projects
How to make a report to compare accounts?
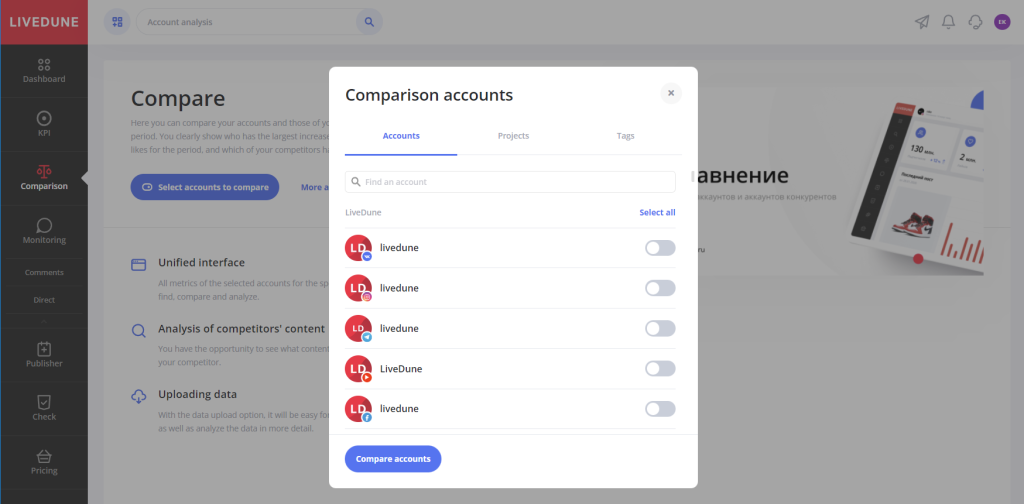
Open the module “Compare accounts” and click “Select accounts to compare”. A window will open with all the accounts and projects on your Dashboard. Use the search bar to quickly find the accounts you need. If an account is not on the Dashboard, you can add it right here.
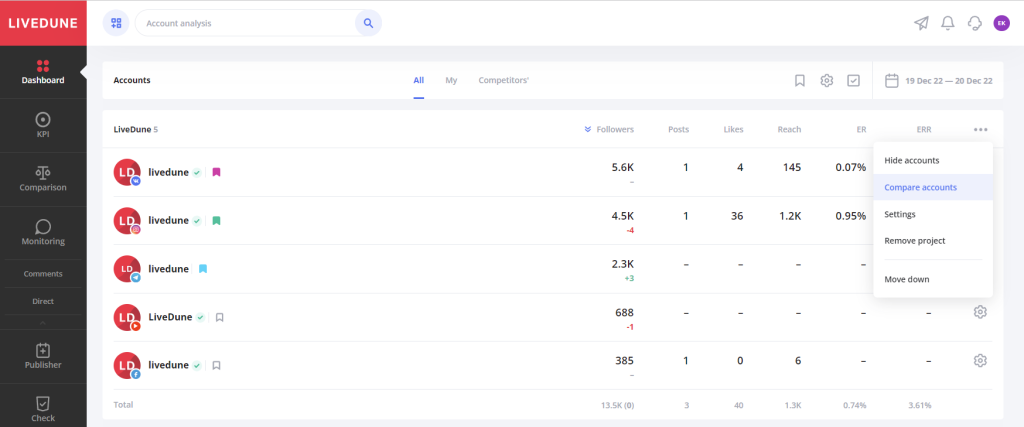
If you want to analyze one of the projects/accounts on your Dashboard, just click on the table-shaped icon next to the category name.
By default, the account comparison time period is 3 months, but it can always be changed in the upper right corner of the screen.
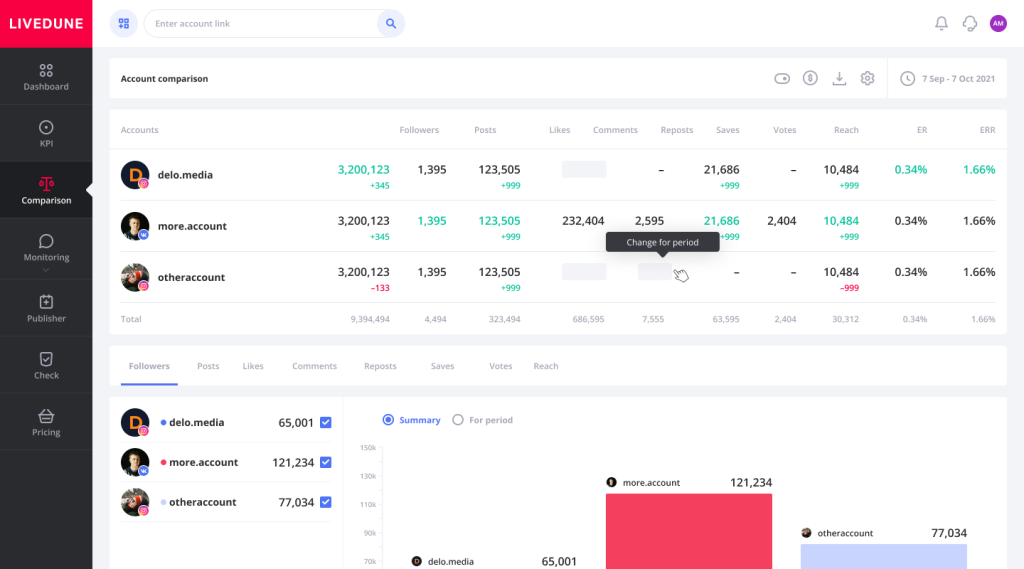
The cells of the main table are highlighted in color:

Green
The maximum values in each column.
Grey
Values that, in principle, cannot be calculated for this social network. For example, the value of Instagram reposts.
Large numbers
The sum of the parameter for the analyzed time period is indicated.
Small numbers
Average parameter value for the analyzed period. If a “+” sign is in front of a small number, then this figure shows how much a particular indicator has grown during the period. The “-” sign, respectively, shows a decrease.
If none of the accounts have data for one of the columns, then it will not be displayed. Each cell is clickable. Do you need more details on any of the numbers? Click on it. For example, you can see a graph of the number of likes a competitor has gained.
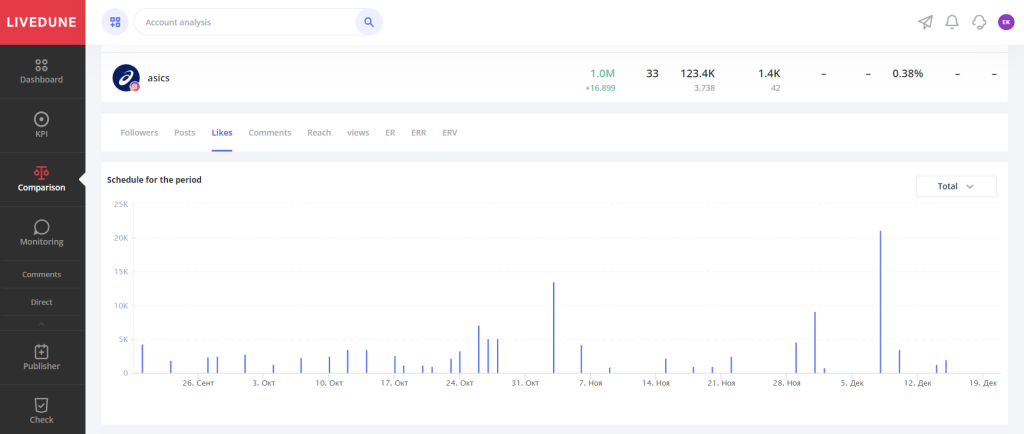
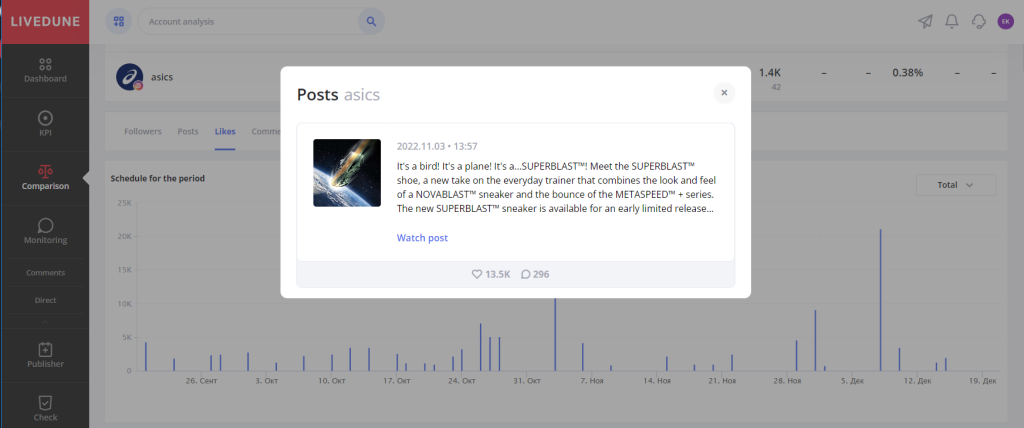
If you want to see what posts were published, for example, on November 3 (peak in the number of likes), click on the graph. The list of posts will be loaded, showing statistics for that time period.
The second part of the account comparison shows the dynamics of changes in the number of followers by day for the analyzed period. Data in it can be grouped by day / month / quarter. For example, having grouped the data by month, you can clearly see changes in 12 lines by periods, rather than 365 days.

Comparing projects
This report allows you to compare several brands at once in all social networks in which they are present. To do this, create projects for each brand on the Dashboard, and in the “compare” module, select compare projects, not accounts.
The service, as well as comparison of accounts, will calculate the total number of followers in all the brand accounts, total ER, likes, posts, etc.