
What Is an Engagement Rate on social networks (instagram, facebook, youtube, twitter) and How To Measure It?

What Is an Engagement Rate on social
networks (instagram, facebook, youtube, twitter)
and How To Measure It?
![]() 6 min read
6 min read
Engagement Rate, aka ER – shows the amount of active followers or engagement. What is its formula and what Engagement Rate is normal on Instagram and other social networks? We explain this in the following article.
The engagement rate on social networks is measured as a percentage and shows how much the audience of the account responds to posts. Responses mean likes, comments, reposts, votes in polls, as well as level of retention (for your Instagram accounts).
Сontent
1. Engagement Rate Formula
2. Engagement Rate Reach Formula
3. Engagement Rate Views Formula
4. What Engagement Rate is normal?
5. Comparisons of Engagement Rate, ERR and ERV
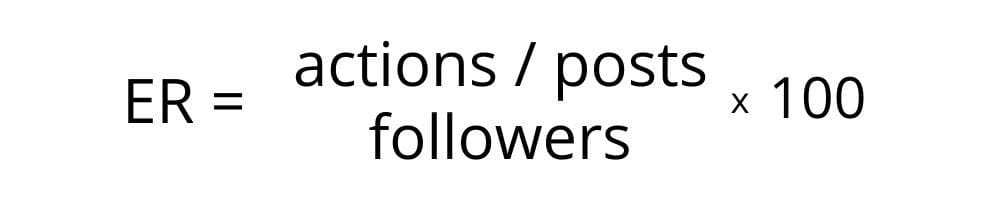
Engagement Rate Formula
Traditionally, the ER formula is the same on one post or on all posts for the period. First you need to calculate the average number of reactions to the post – for this we take all the posts for the period (for example, per week) and summarise the reactions. The total number is divided by the number of posts for this period. Next, we divide the resulting value by the number of followers in the account and multiply by 100. The result will be the level of engagement on a particular profile on a social network.
Each social network has its own, different set of user reactions.
| Social network | Reactions |
| Likes + Comments (+ Saves for your accounts) | |
| Reactions (Likes, Wow, Super, etc.) + Comments + Reposts | |
| YouTube | Likes + Dislikes + Comments |
| Likes |
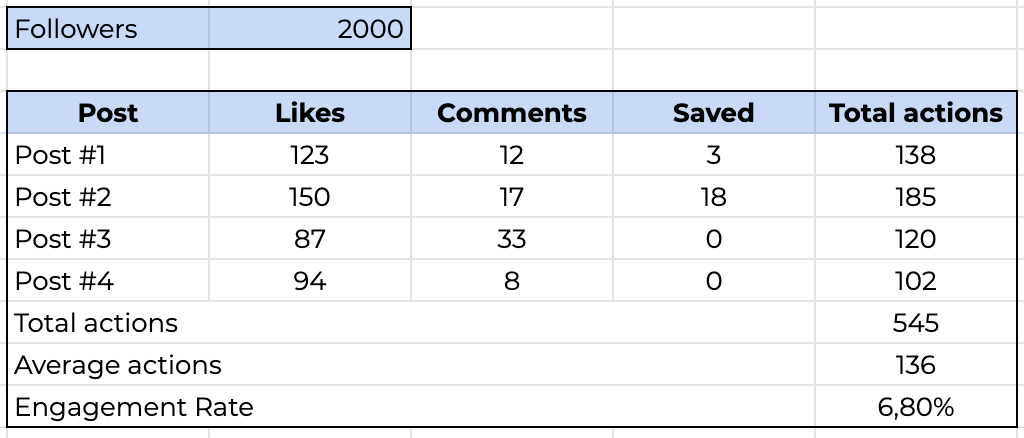
For clarity, a table with Instagram audience engagement calculations:
Engagement Rate Reach Formula
Every day, social networks are growing more and more, accounts are expanding to huge sizes. Accounts with 100 million followers on Instagram are no longer newsworthy. Therefore, to calculate engagement in 2018, marketers are increasingly using the Engagement Rate Reach metric, or ERR for short.
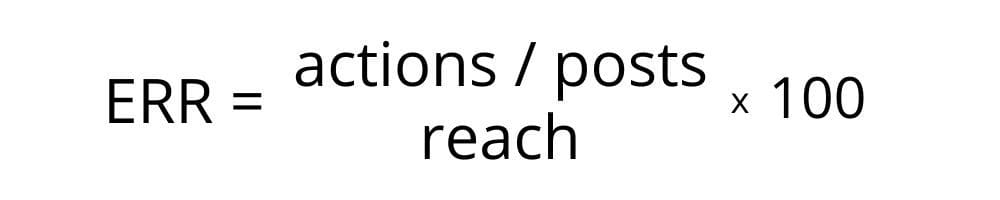
The ERR formula is almost identical to ER, but it is considered not from followers, but from the average coverage of posts. This formula is more effective and accurate, because some followers have not been active for a long time, and some do not see your posts due to algorithmic feeds in social networks. So why consider the average engagement from these followers? It is much more logical to consider precisely those who see your posts.
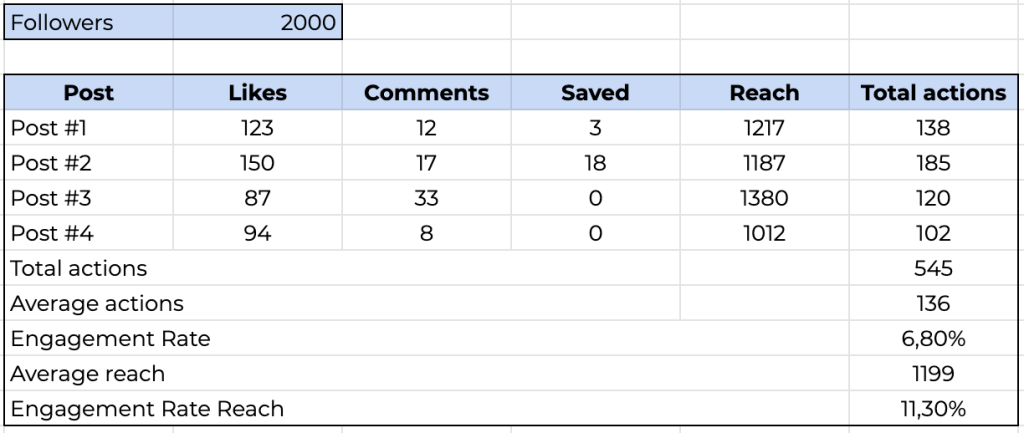
All that is added in the table above is the Coverage column, and we calculate the average coverage of the audience for a post and divide by it the average number of reactions – this is the Engagement Rate Reach.
In the vast majority of cases, the ERR will be greater than the ER, because Reach is always less than the number of followers. But if you promote posts with internal social media advertising, then it is highly probable that the ERR will be lower than ER, due to the mass spread of the post to other users of the social network who are not your followers.
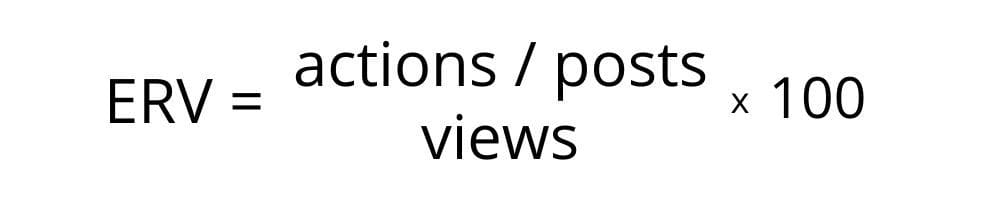
Engagement Rate Views Formula
This formula is only used to calculate engagement on social networks for YouTube (although it can be applicable to other social networks). The fact is that in YT the number of post or video views can be seen by all users and not just the account owner, so it’s convenient to use ERV for comparison. The resulting value will be very close to the Engagement Rate Reach, but slightly less due to the fact that one user can see one post several times, therefore each of these views will be taken into account in the formula.
What Engagement Rate is normal?
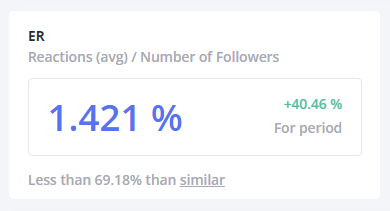
LiveDune users can find the answer to this question is displayed on the account page in the ER widget – it has a small line that shows by how much the specified ER is more or less than accounts from the same content category (by the number of followers). This helps you determine the Engagement rate for your account. We conducted a small study of engagement on a sample of 500K Instagram accounts in order to understand how this indicator varies depending on the number of followers.
And we will analyze some additional metrics that are associated with ER:
ERday – the total ER value for all posts for the selected day. For example, if there were 3 posts per day with ER 1.2%, 2% and 1.6%, then ERday will be 4.8%.
Comparisons of Engagement Rate, ERR and ERV
In addition to calculating ER for posts and in general for a selected period, our service calculates ER every day and saves it for future display in a graph.
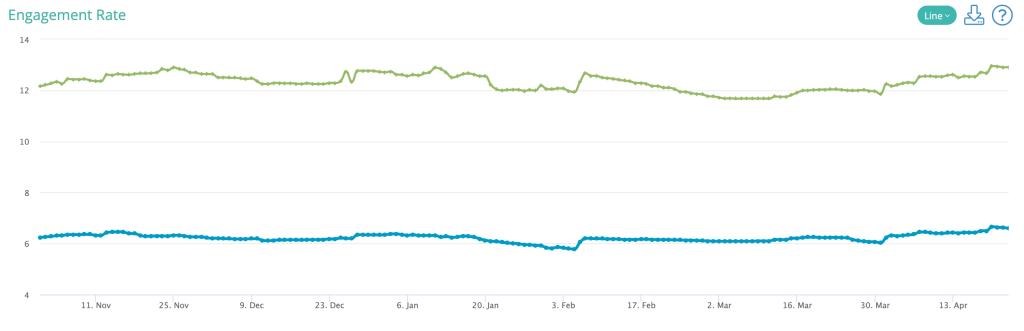
The blue line is ER, and the green line is ERR or ERV. The daily value is calculated at night (in London) based on the last 20 posts.