
In this article, we shed some light on the benefits that Instagram statistics from LiveDune provide for your account.
Every Instagram user tries to ensure their posts will appear at the top of their followers’ feed. If a post is well planned, it will undoubtedly be noticed and favoured by your audience, and the content will be pushed to the top alongside the best by likes and recommendations.
Let’s try to figure out how understanding the statistics our service provides will help you improve your account.
The best time to post on Instagram
Although it is wrong to say that there is a certain best time to post on Instagram, ways to predict the most advantageous time for publishing posts do exist. If the time for posting is scheduled well, the chances for the post to hit tops by likes and hashtags increase significantly. Therefore , finding your personalized best times to post based on your unique audience might result in higher engagement. To start off, find the graph “Followers online” under the tab “Audience”.
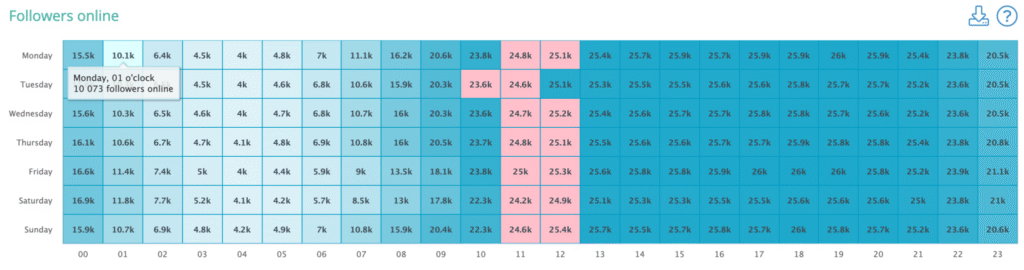
The first two hours of the twelve-hour period, when the number of your online subscribers is the highest, are highlighted in pink. It is the time period when it is a good idea to publish your posts.
What content is most favoured by your audience?
You can find the most popular content for your audience in the Top rankings by likes, comments and engagement located in the All tab in the bottom of the page.
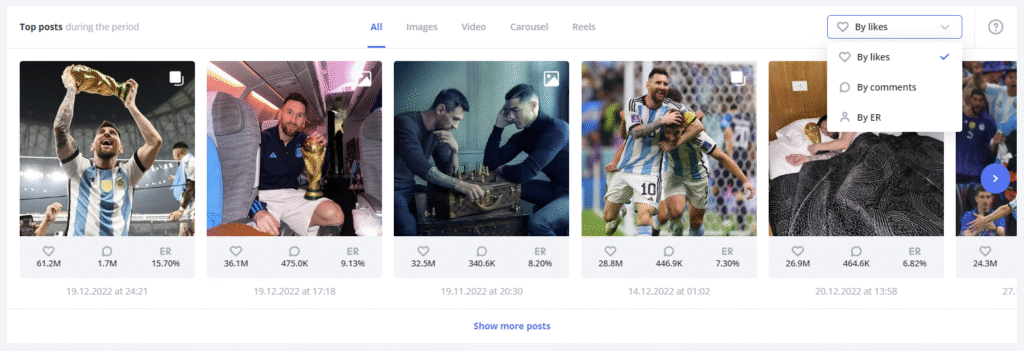
The statistics of top ratings are very useful for understanding the types of content that click with your audience. Try to find an answer to the question: “Why did these posts have more likes or comments?”. Check out the text of these posts, but remember that usually followers first look at the pictures.
Look for ideas and improve your Instagram feed
If you’re hunting for new successful topics, accounts with similar content, or your competitors’ accounts, should be monitored as well.The top-6 posts here are similar to what we have just seen with the most liked content. The method of analyzing remains the same – looking at the statistics of likes and comments will give you new ideas for your own posts.
If your blog is about psychology, find similar accounts and follow them, paying attention to posts that engage visitors and draw interactions.
Unlike other content analysis services that consider all likes while gathering statistics, LiveDune takes only organic likes for analyzing competitor performance, leaving promoted posts aside. This means that the top posts displayed in the analytics will be more objective, since likes received on paid posts weren’t included.
What content should you avoid?
On the tab «Posts», you can sort material in descending order of any of the parameters, as well as in ascending order. Thus, you can view posts that received the least likes and comments. However, it would be smarter to choose the posts with the lowest ERR (or ER if you analyse your competitors) Double-click on the heading in one of the columns, and you’ll see your least engaging content.
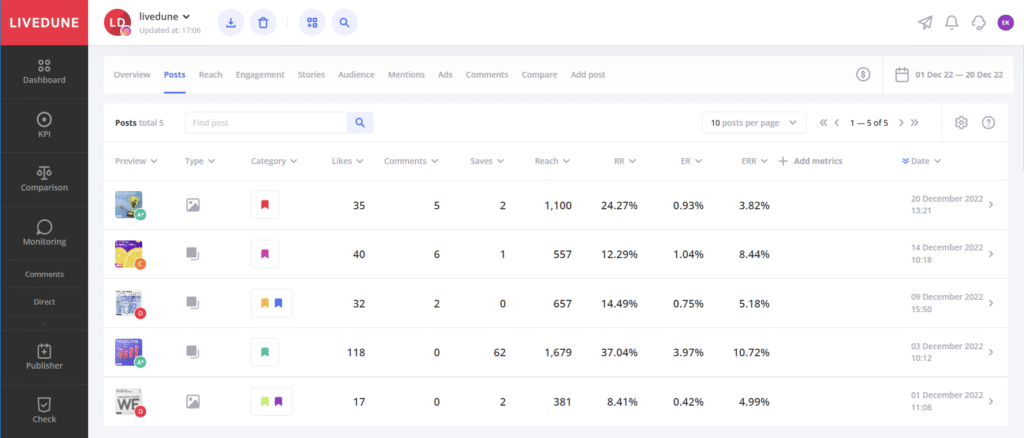
Consider why these posts perform worse than others? What is wrong with them? Find answers to these questions, and you can discover what your audience does not like. For example, at @asos the posts with people on them score more likes than posts without people.
What is the best caption length for Instagram posts?
Does it always make sense to type long captions? The perfect scenario will be if captions inspire your audience not only to ‘like’ a post for a beautiful image but also to share their opinion in comments and save the post.
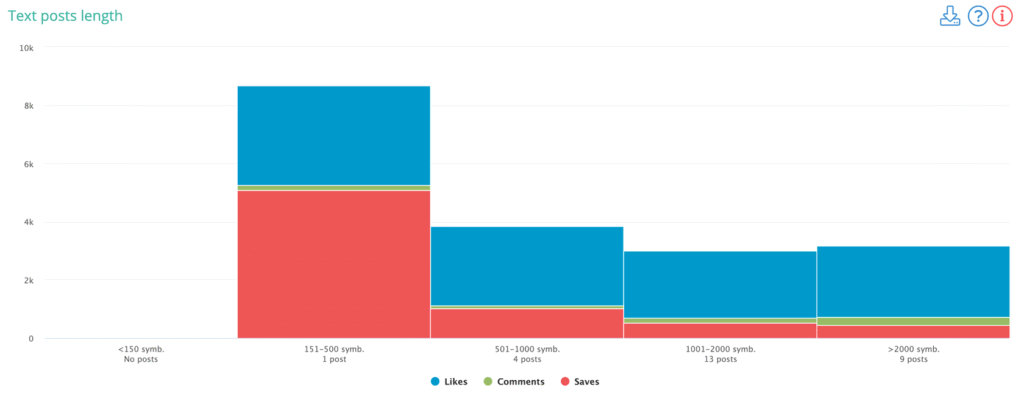
However, sometimes posts with extended captions bring neither saves nor comments. So what’s the point in writing them? Perhaps it would be better to craft two shorter posts.
Another idea might be reconsidering the themes you cover in your posts. Move up to the third paragraph of the article to see what your competitors write about.
Best stories by replies
The situation with stories is quite complicated. People publish them more often than regular posts, and so it is rather tricky to catch precious attention from followers. Yet your followers can leave one of six reactions on your story that will come to your Instagram Direct messages, and these reactions will be counted as interactions with your Stories.
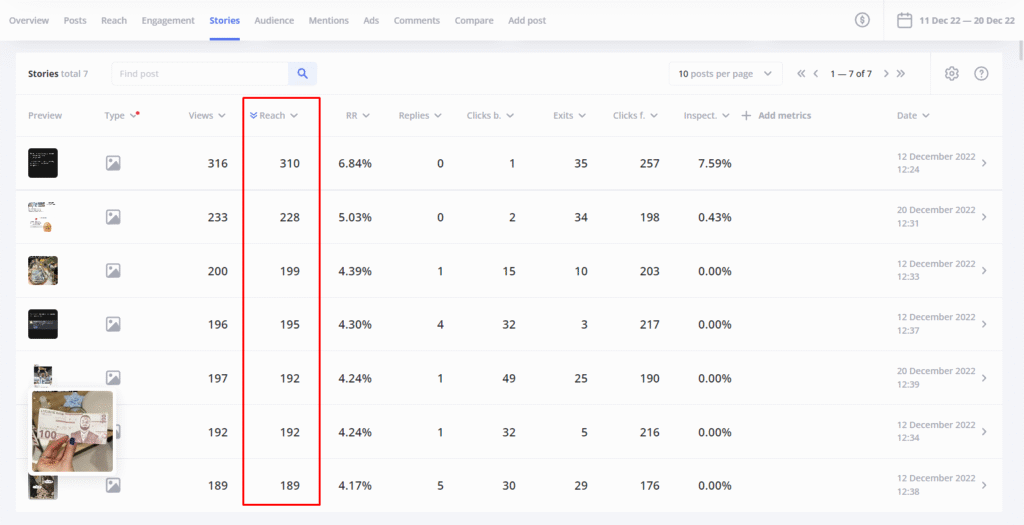
Each reaction to your Stories strengthens the connection between followers and you, which means Instagram will show your Stories and posts to subscribers who’ve already interacted with your content previously in their feed. Like you did in the second paragraph, try to figure out what makes these stories unique, and post similar content. It should be mentioned that typically stories are related to current events in life depicting what is happening currently, and it’s not always possible to successfully replay past experiences in the future. However it won’t hurt if you give it a try.
A closer look at the Engagement rate dynamics
If you’re not familiar with this indicator, first take a glance at the article «What is Engagement Rate?». This metric is like a test: if it grows, you’ve been doing everything right and did your homework well on the previous 6 paragraphs of this article.
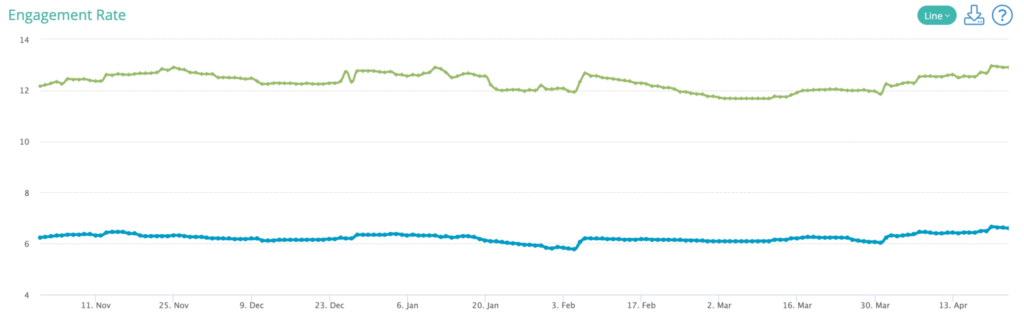
In addition to that, if the ER remains on the same level, and the number of followers increases, it is a good sign. Usually, the ER metric decreases with the growth of followers. Even if the curve in your graph goes down slightly, you can see an indicator showing how much higher your ER is than that of similar accounts.
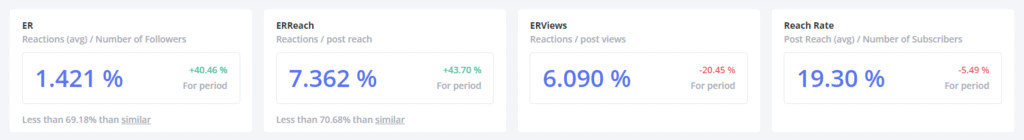
If this indicator is higher than that of your competitors, everything is great, and no changes should be made. However, if it’s lower and your rival accounts enjoy the higher engagement, you have something to work on to increase the activity of your audience. The ER is also influenced by the number of bots among the followers of your account. Blocking bots won’t increase your reach, but it can raise the ER to some degree. Using automatic bot blockers isn’t an option, as there’s a chance of crushing the account completely. It will be much safer to get rid of bots manually — a slower but more secure strategy.
What types of posts does the audience best respond to?
There are 3 types of posts: images, videos, and carousels (featuring up to 10 slides of photos/videos). Videos always gain fewer likes than images, but if there is a big difference in the average number of likes between regular posts with an image and a carousel post, then it’s time to figure out why this takes place. The graph of the average number of reactions per post is shown on the screenshot below:
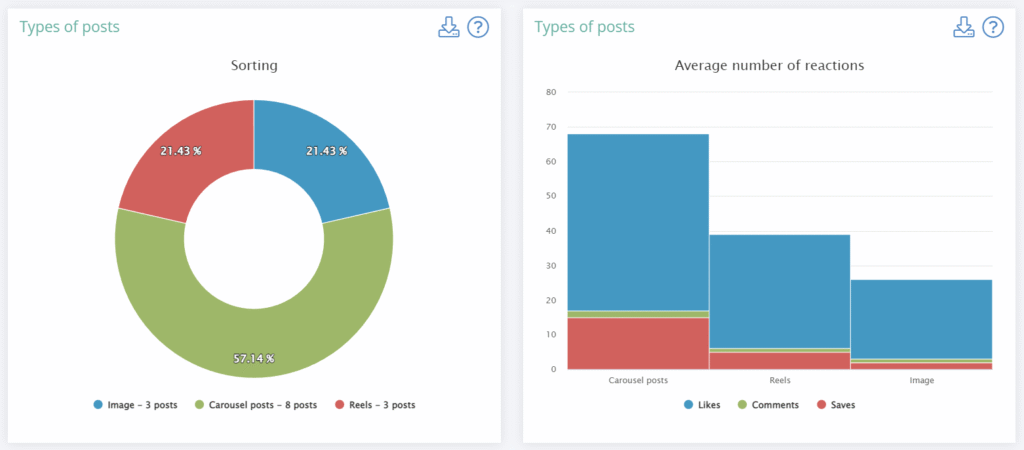
On the same graph, we can also find that another account has a different situation with the same metrics: carousels gained a very low level of engagement, which is even lower than that of videos. You need to look at all these carousels and answer the question we’ve asked many times before, «Why did these posts receive so few reactions?»
Evaluating coverage dynamics
There is a «Coverage and View» graph on the tab Coverage. Switch it to the «Month» mode:
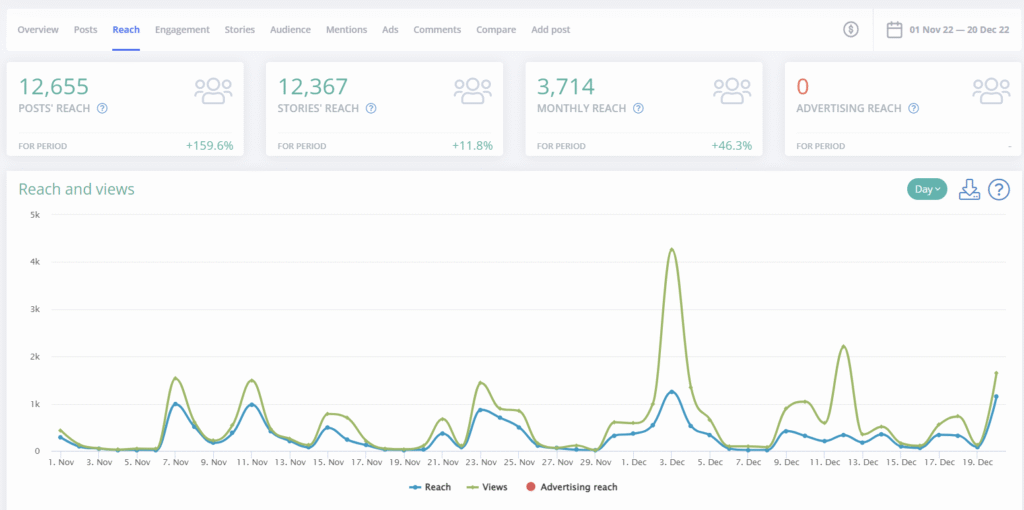
Every point on this graph shows how many Instagram users have seen your account during the last 28 days. Monthly coverage rate is just as crucial as the ER, and unlike the latter, it should continuously grow, and you must ensure that constant growth. Every mistake you make with your content will be reflected in this graph. For example, coverage will go down if you start posting less or misuse hashtags.
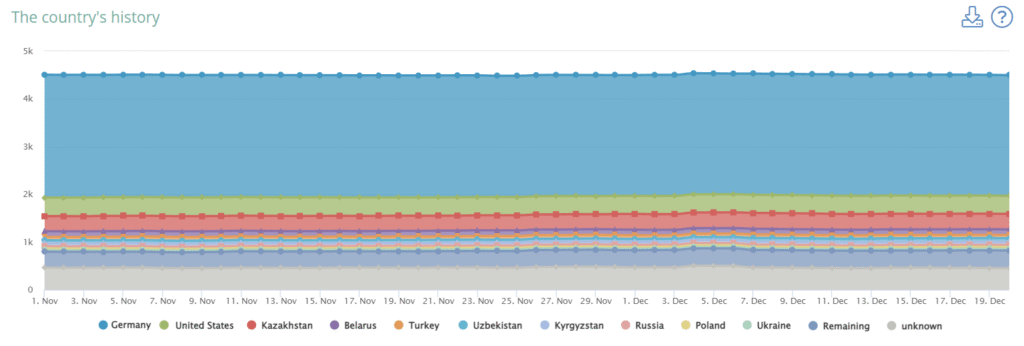
Location of followers
Although many users underestimate this graph, it provides valuable information that may be used to evaluate growth of followers from London or any other particular city or a country.
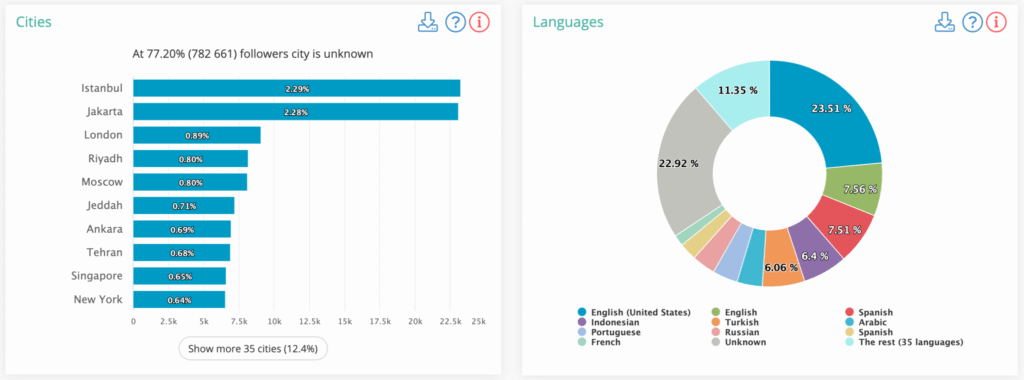
Language of your audience
Monitor which language does majority of your followers speak. IF your audience is split between 2 languages, then write your posts in both of them, i.e. have 2 parts in each caption.
Gender ratio
If you have an approximately equal number of subscribers of both genders, this chart won’t provide you with any interesting data.
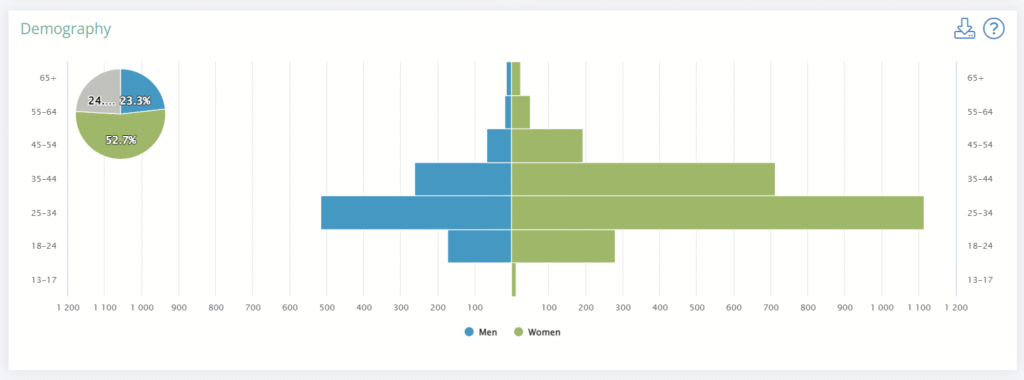
However, if one of the genders prevails, this statistic shouldn’t be ignored. Suppose 20% of your followers are men, so posts focused primarily on this gender will fail in engagement rates. Keep in mind that content has to be targeted on the prevailing gender of your account’s audience.
Content categories
Most popular accounts exist based on a content plan. It is not just a list of posts split up by days for a month in advance but also a set of post categories. For instance, a fitness mom can talk about healthy food on Mondays, describe her workouts on Wednesdays, and share news about kids on Fridays.
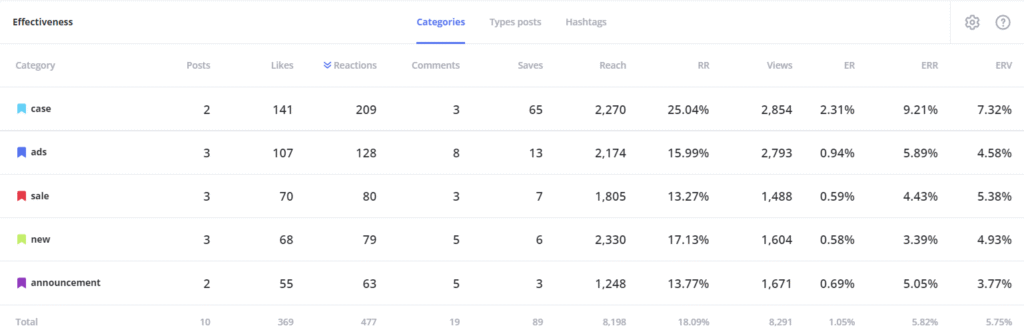
Specify the categories of your posts and view the analysis by each category on the tab «Posts». Review those categories which aren’t favoured by your audience and replace them, introducing new types of content. If, for example, your audience does not react to posts about animals, then there is no point to write about them. Write about topics that are interesting and engaging for them.
Initially, you can keep 5-6 categories or even more, and after a while leave only 3 most appealing themes for your followers.
When do your followers engage with you the most?
You can find the chart «Comments» on the «Engagement» tab. It is completely identical to the «Subscribers Online» chart from the first paragraph, and there is even a correlation between them:
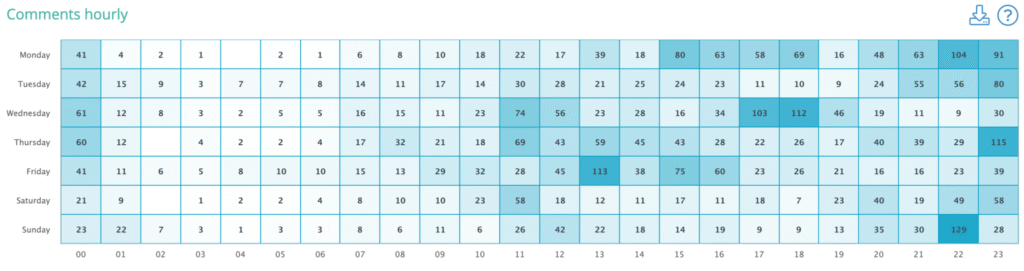
The graph reflects the hours and days of the week when comments were received. It also indicates the time when the majority of comments appeared, and additionally, when only a few were left. It’s good to know if you are running a business on Instagram as it is vital to respond to comments quickly. According to the schedule, you will understand when your followers communicate the most, which means that it’s the best time to be online.
Dynamics of followers
This chart reveals the posts that were welcomed the best by your audience and attracted new followers. And on the contrary, it will let you know what content urged people to leave your account. Click on any point in the chart, and a list of posts published on a specified day will appear below.
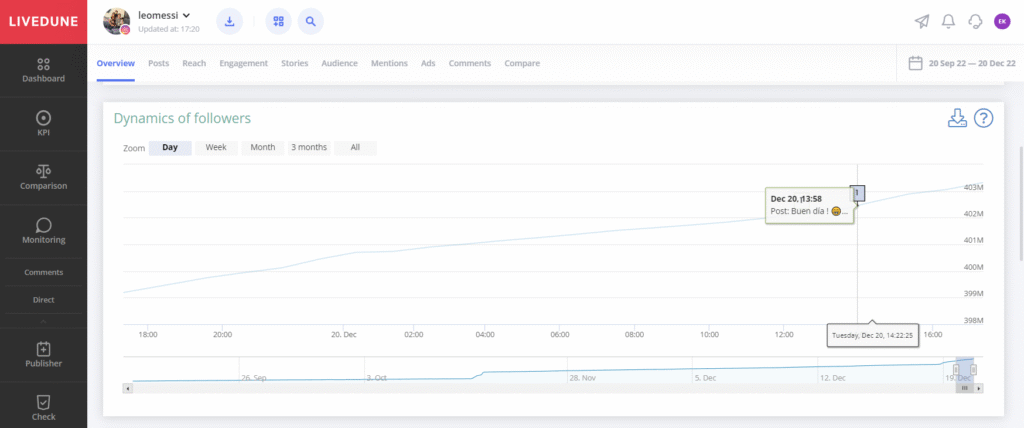
Remember that your content is not the only source of growth. Other bloggers could mention you in their posts or comments, and as a result, some of their followers could discover your account.
Reports
If you manage the accounts of your clients or an employer, downloading reports in PDF will become your indispensable assistant. More than 30 pages of useful information will uncover how the account has changed over the selected period. You don’t need to collect these numbers every month, wasting hours of your time, the service will do it for you.
How is data collected?
Statistical information on private accounts and those of your competitors is updated hourly in all pricing plans – which allows us to collect the most relevant data, save it, and build graphs, which you can use to make necessary conclusions.
When you launch our service for the first time, you’ll find that some of the graphs may be empty. This is because unfortunately we can’t retrieve data from previous periods. However, once you’re subscribed to one of the pricing plans, all statistics will be collected non-stop.
Answers on the most
common questions
Why is it so important to understand Instagram statistics?
It helps with improving your account, tracking content performance, and boosting engagement on the publications.
What types of posts and stories does the audience best respond to?
Videos, images, and carousels usually bring the most engagement.
How to compare Insta pages from my category?
The best idea is to find your personalized best moments to post based on your unique audience. It might result in higher engagement.