
Engagement Rate (also known as ER) is the percentage of an account’s active audience. Activity, in this context, means various users’ reactions to what is published. Instagram*, for example, has likes, comments, video saves and views. VKontakte also takes reposts and votes into account. In this article, we discuss the formula for the coefficient of engagement and what Engagement Rate is normal in Instagram and other social media platforms.
Engagement Rate Formula
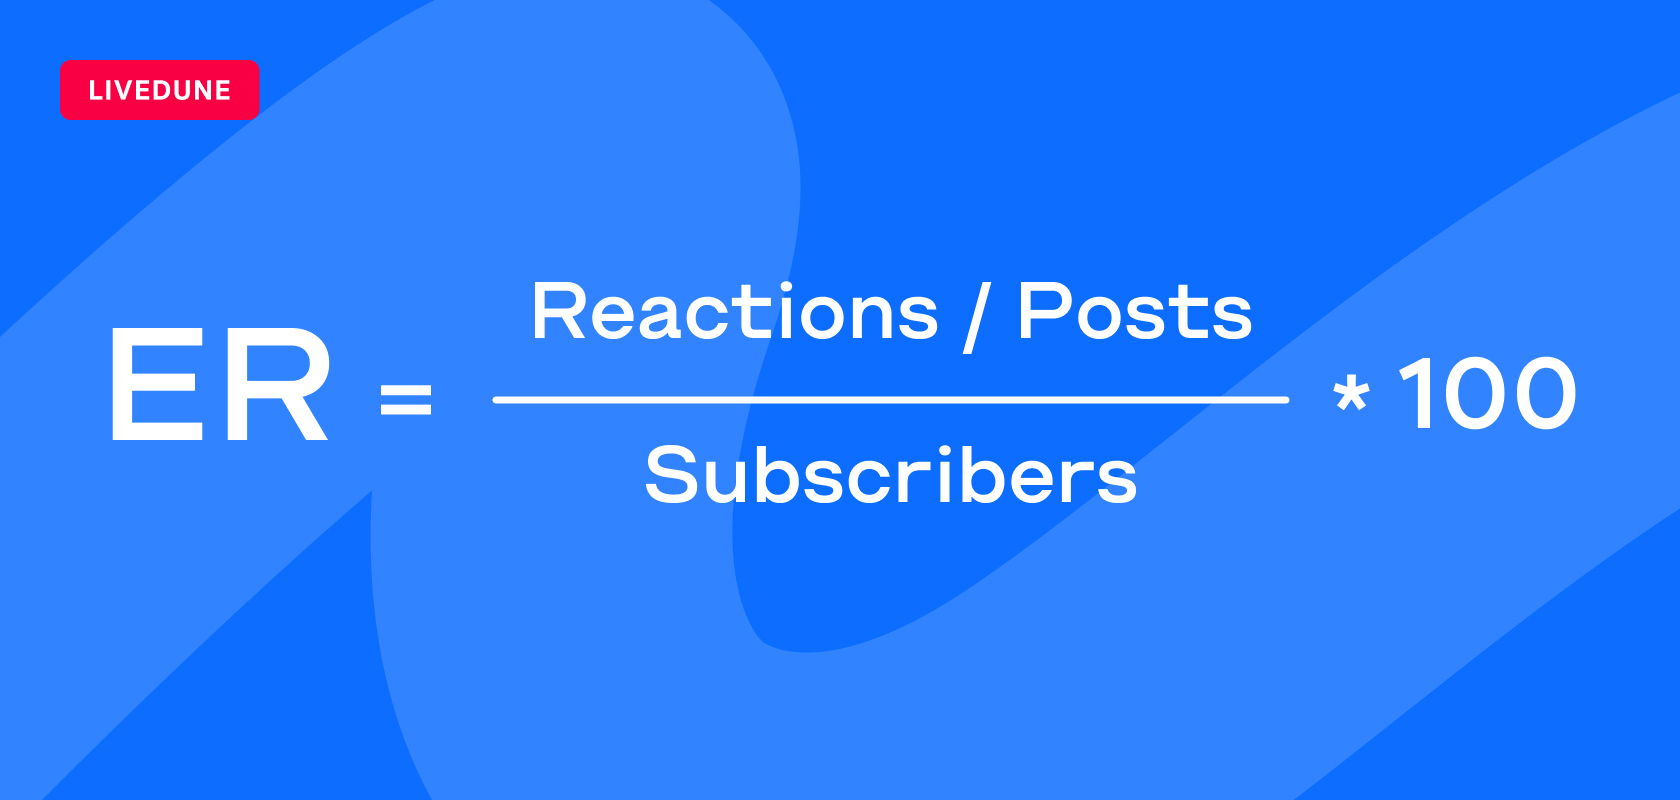
Traditionally, the formula for Engagement Rate doesn’t change and is based on either one post or all posts over a period. First, we need to calculate the average number of reactions to a post. For this, we consider all posts for a period (1 week for example) and sum up all reactions. The total number is divided by the number of posts for that period. Then, that number is divided by the number of subscribers (to the account) and lastly, we multiply that number by 100. And that will be the level of social media engagement.
Every social media platform defines reactions differently. For example, Vkontakte and Ondoclassniki take reposts and votes in surveys into account.
LiveDune can be customized to show engagement indicators (available on the “Business” and “Agency” tier plans):
1. You can set parameters for calculating engagement for the entire account.
2. The graph with ER, can show naturally occurring ER separately from ER with ads, if a commercial account has already been linked to LiveDune. If not, you can link it in the Advertising tab. Next, in the account header, you can toggle the dollar icon, to change views between the original and promoted data.
The Engagement Rate Reach (ERR) Formula
In the era of algorithm-driven feeds, the Engagement Rate (ER) has become a less accurate indicator of engagement due to its dependence on the total number of subscribers. Not all subscribers are active (business accounts for example) while others just don’t see your posts in their social media feed. Including those kinds of subscribers (after all, they haven’t even seen your post) in your calculation won’t give you a realistic picture.
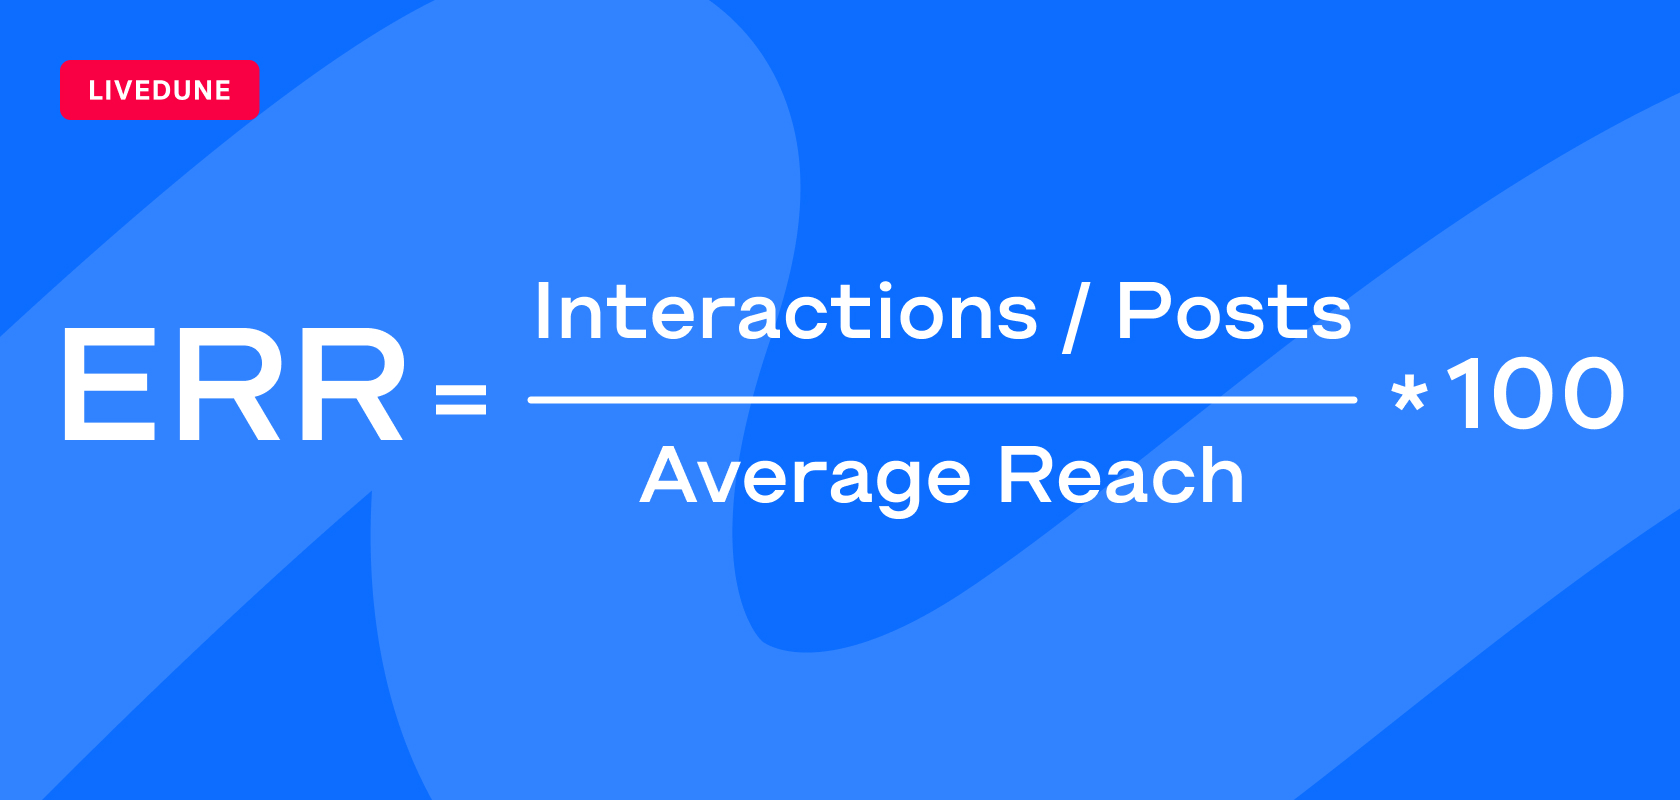
It’s better to evaluate the level of engagement using the Engagement Rate Reach (ERR) metric. The ERR formula, while almost identical to the ER formula, is calculated using the average reach of posts instead of using the number of subscribers.
All that we added to the table was a column for Reach, which we use to get the average and divide the result by the average number of reactions – and that’s the Engagement Rate Reach. Since reach is less than the number of subscribers, in most cases, ERR will be greater than ER. But, if you promote posts with internal advertising, then, your ERR will most likely be lower than the ER due to the large number of views from users, who aren’t your subscribers on that social media platform.
The Engagement Rate Views (ERV) Formula
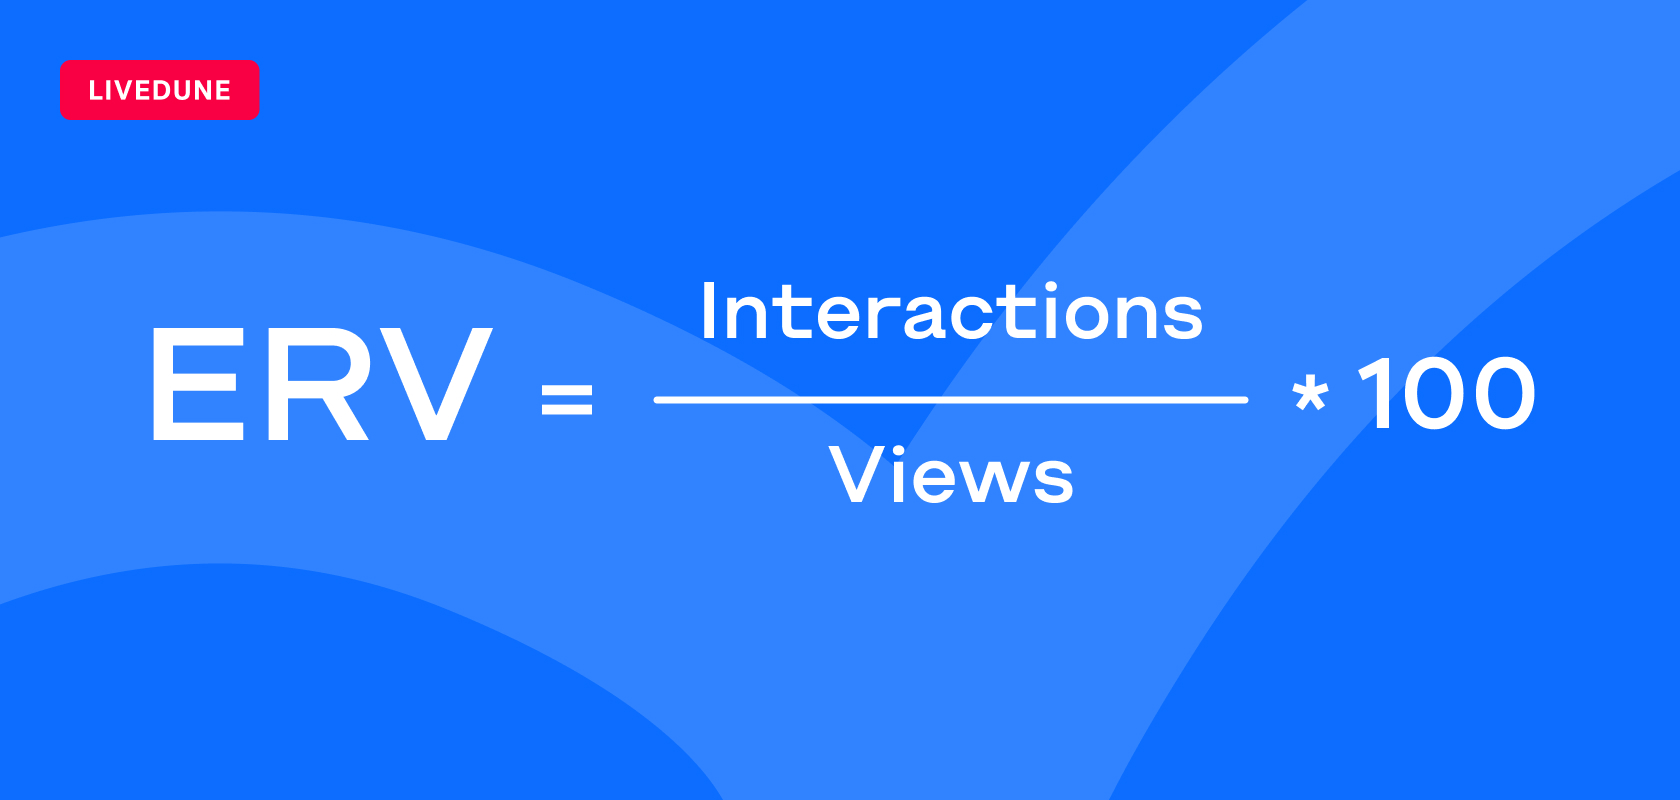
This formula is used to calculate engagement in social media only for Vkontakte (VK) and Youtube (YT) (although it’s also applicable for other social media platforms). The reason for that is, that a post’s view count in VK and YT is visible to all users, not just the owner of the account. So it’s convenient to use ERV for comparisons. The resulting value will be very close to Engagement Rate Reach, but a little less due to the fact that one user may see one post multiple times, and every view is included in the calculation. For more information about views and coverage, see the Glossary section.
What are normal values for Engagement Rate?
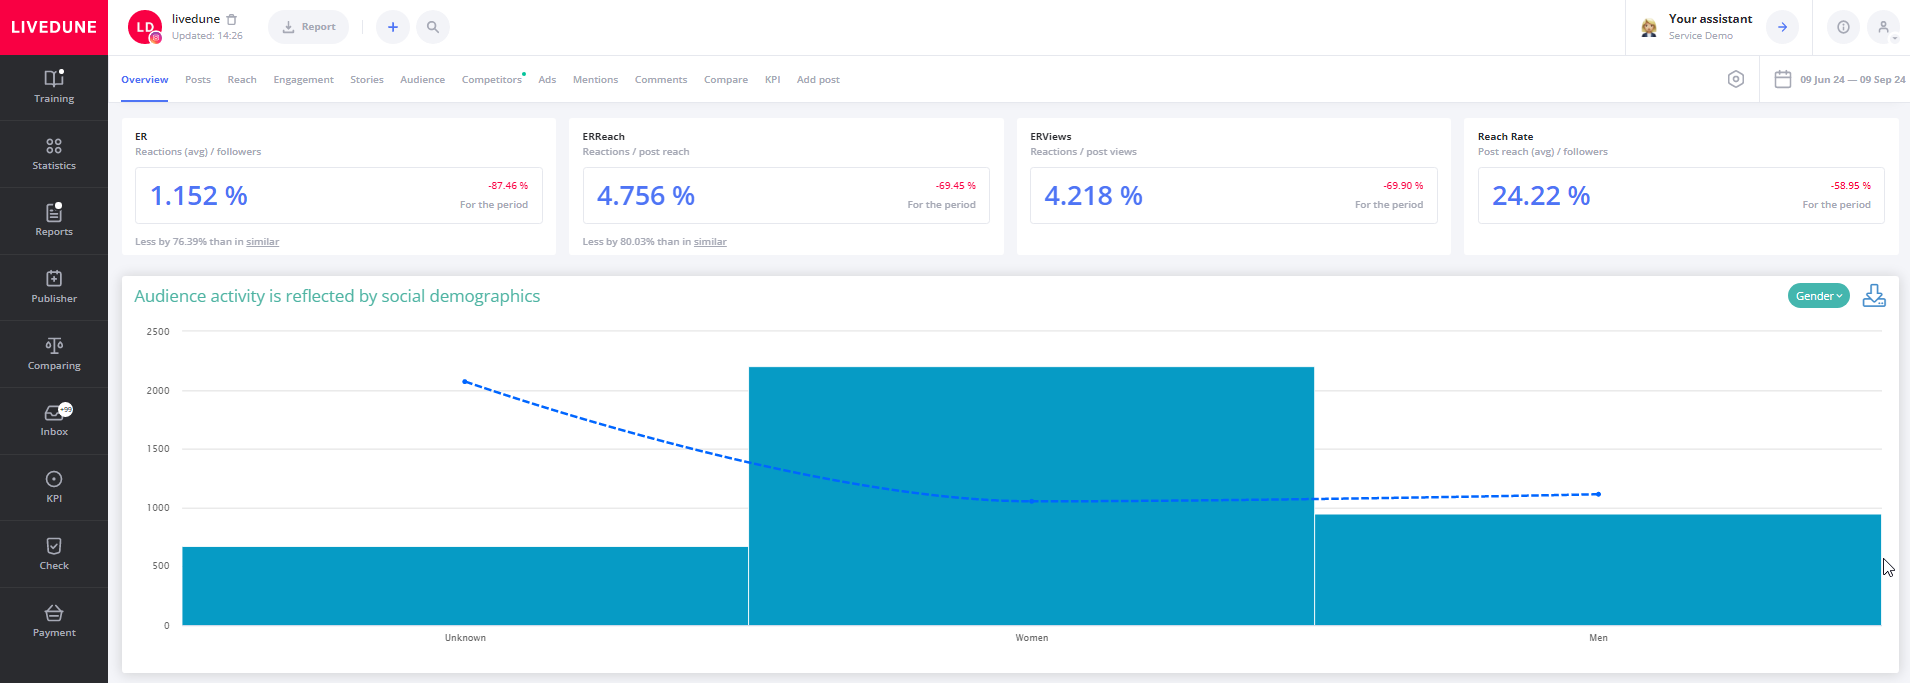
The answer to this question is displayed on the account page in the ER widget, which has a small line showing how many times the specific ER is greater or less than the ER is for a category for an account in the same weight class (by number of subscribers). This way, you can determine how your account stacks up in terms of Engagement Rate with similar accounts. We conducted a small engagement study on a sample of 500,000 Instagram* accounts to find out how this value changes in relation to the number of subscribers. For example, here is a screenshot of Aleksey Tkachuk’s account. His ER is 92% lower than communities with a similar number of subscribers.
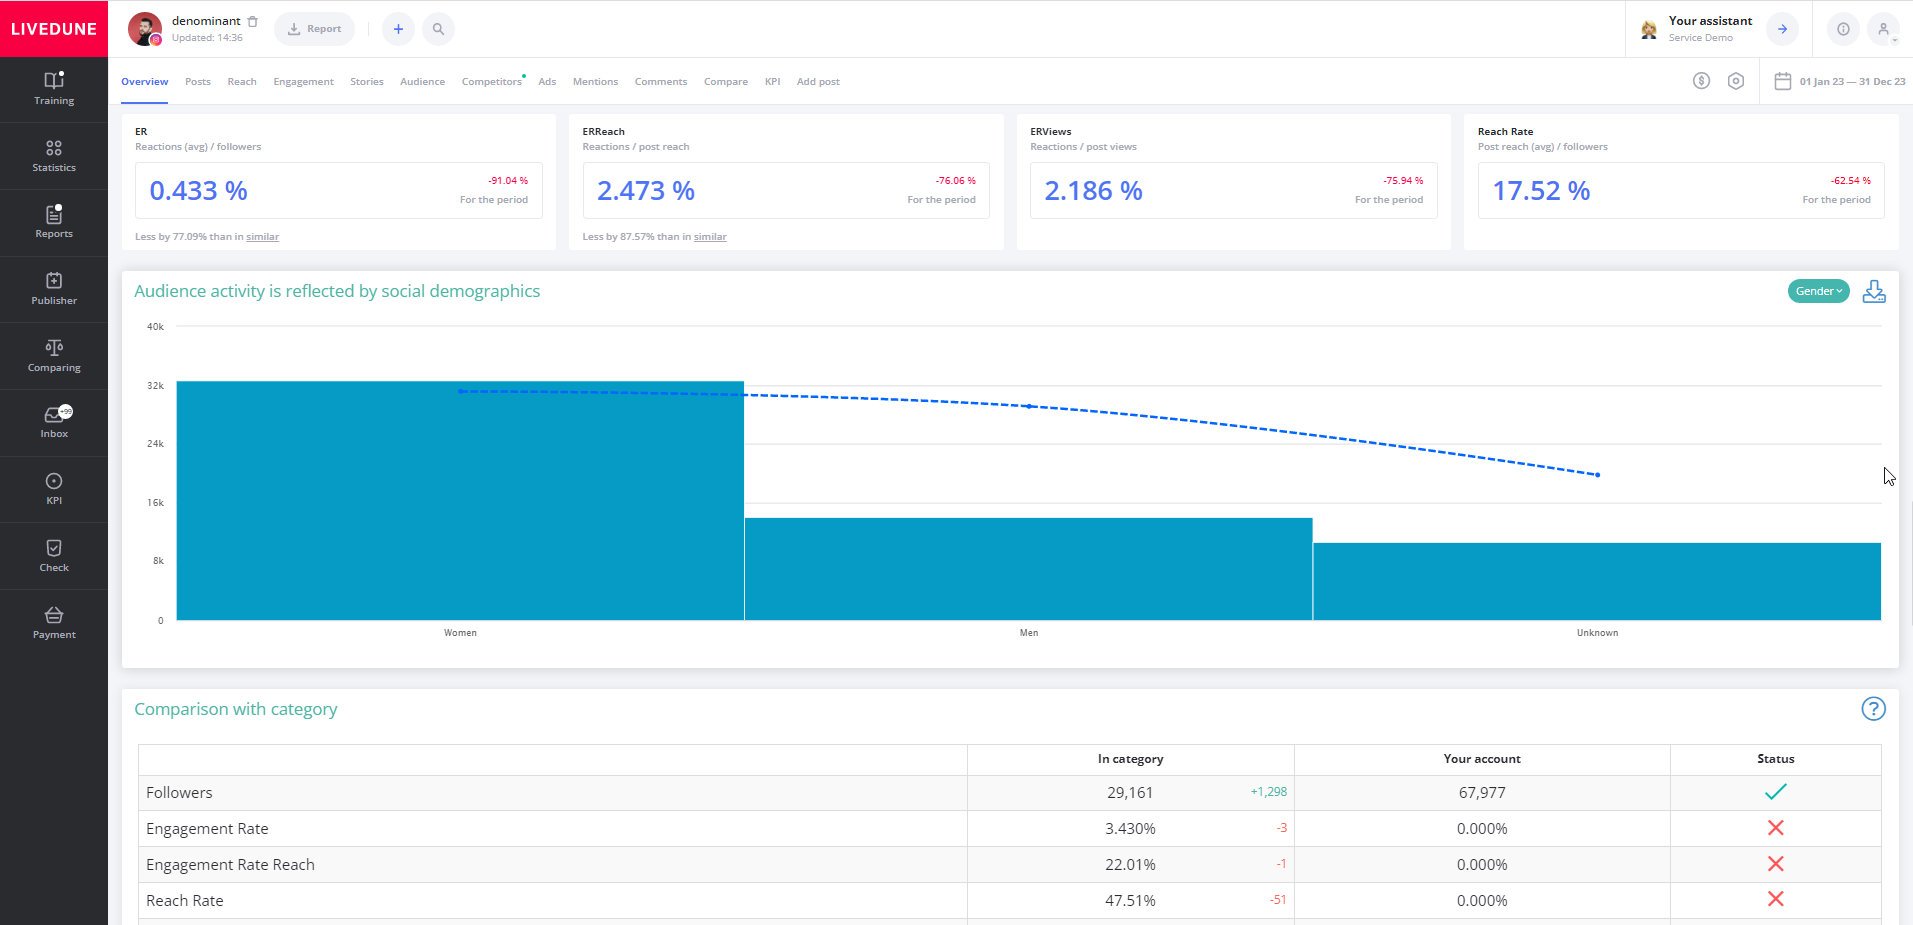
Reach Rate / Views Rate
Reach Rate (only for your accounts, expect Youtube) – shows the relationship of the average reach to subscribers for the selected period. This figure helps you understand what part of Instagram users you’ve reached.
Views Rate (for VKontakte and Youtube accounts belonging to others, as well as your own Youtube accounts) – shows the relationship of subscribers to the average number of views and posts for the selected period.
Dynamics of Engagement Rate, ERR and ERV
In addition to calculating ER for posts and in general for a period, our service calculates ER every day and saves it for further display as a graph.
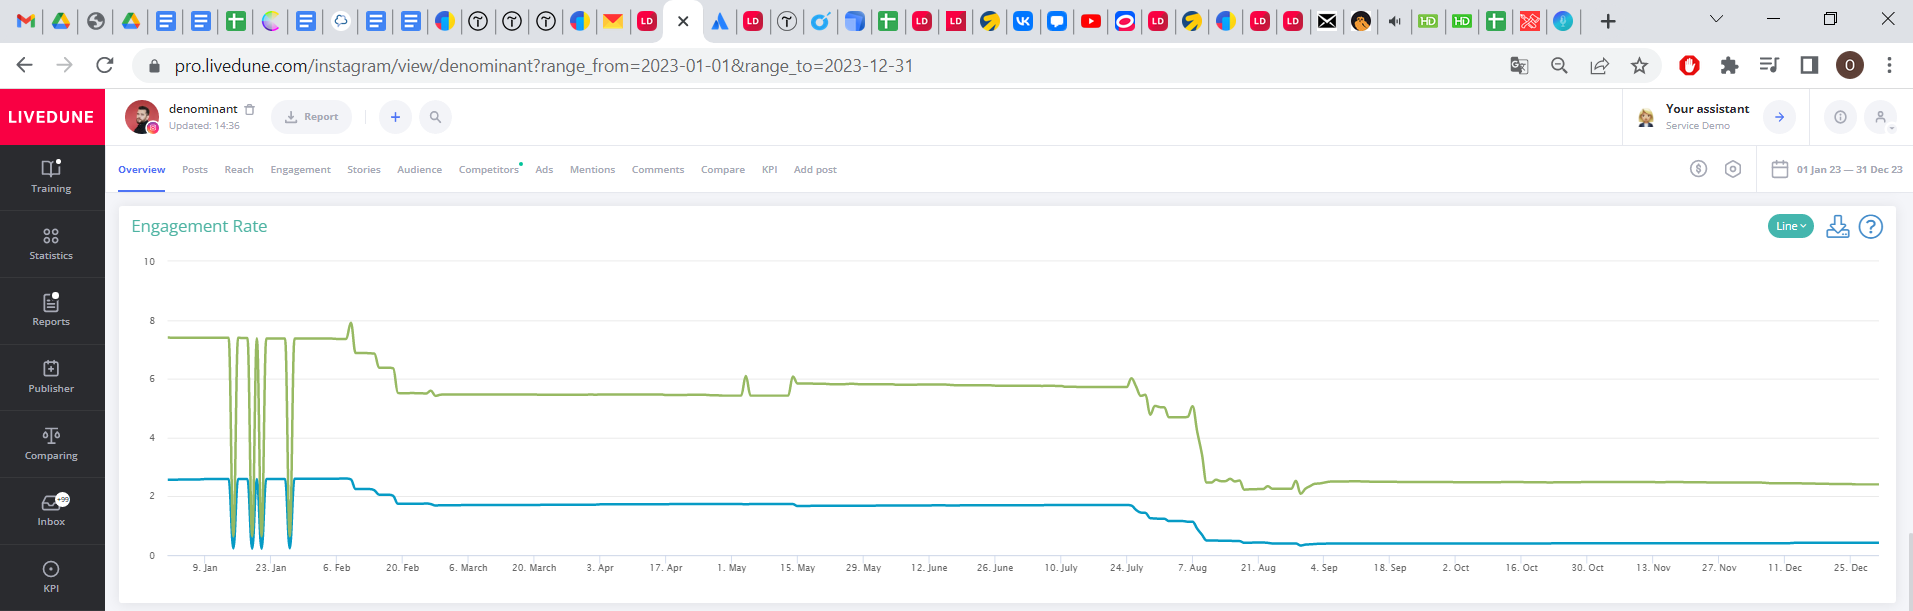
The blue line represents ER, the green line represents ERR or ERV. The daily value is calculated at night (Moscow time) based on the last 20 posts.